The brain needs only about 150 milliseconds to tell whether a photo contains an animal, and in that time light passes through a long chain of transformations. This article follows the visual stimulus from the retina, which compresses the image into attributes, to the visual cortex, which breaks it down into lines, and on to the frontal regions that assess its interest and beauty. It then explains what an EEG sensor placed on the forehead records, what it can measure and what lies beyond its reach, starting from the alpha rhythm discovered by Hans Berger. In the second part, science turns into design, with guidance for product launches, trade fairs and corporate events, and four BrainArt experiences in which the stimulus was a video.
Key takeaways
- In Thorpe, Fize and Marlot’s 1996 experiment, brain activity distinguished photos with and without animals about 150 milliseconds after a presentation lasting just 20 milliseconds.
- According to the 2021 review by Kim and colleagues, the roughly 126 million photoreceptors of a retina converge on about 1.2 million ganglion cells, so the image that reaches the brain is already compressed and split into attributes.
- In Simons and Chabris’s 1999 study, nearly one observer in two, busy counting the passes of a ball, failed to see the gorilla or the woman with the umbrella walking across the scene.
- Across 16 observers and 109 artworks, Vessel and colleagues measured an average correlation of just 0.13 between the aesthetic judgments of any two people, with the brain networks involved largely the same for everyone.
- The Muse 2 used by BrainArt records from AF7, AF8, TP9 and TP10 and does not cover the occipital cortex; using a first-generation Muse, Krigolson and colleagues were nonetheless able to measure the N200 and P300 in a visual task with 60 participants.
- In Krigolson’s 2017 study, setup and tasks with the Muse were completed in under 10 minutes, compared with an average one-hour session using a 64-electrode lab system.
A photograph appears on a screen for twenty milliseconds, then disappears. The viewer must decide, as quickly as possible, whether it contains an animal. In 1996, Simon Thorpe, Denis Fize, and Catherine Marlot, at the Centre de Recherche Cerveau et Cognition in Toulouse, recorded the electrical activity of participants’ brains during this task, i.e., in response to a visual stimulus. Responses to images to be discarded began to differ from those to be reported approximately 150 milliseconds after the photograph appeared, according to the study published in Nature, and the authors concluded that the visual processing required for that distinction is completed in less than 150 milliseconds. The manual response came later, because the time for movement is added to the viewing time.
Within a few tenths of a second, light becomes an electrical impulse, is compressed, sorted, broken down into lines and colours, and recomposed into objects. The tenth and a half measured in Toulouse is enough, according to the authors, for a rough initial categorisation, while more refined recognition takes longer. Following this path helps us understand what happens in the mind of someone looking at a product, a video, or an artwork, and what an instrument placed on the forehead can read from it.
Visual stimulus: from light to electrical impulse, the work of the retina
The first step occurs in the retina, the thin layer of nervous tissue lining the back of the eye. Photoreceptors absorb light and convert it into an electrical signal. Rods work in low light and provide greyscale vision, while cones are used for daytime vision and colours. The review by Kim and colleagues published in Frontiers in Neurology in 2021 estimates approximately 120 million rods and 6 million cones, compared to about 1.2 million ganglion cells, the neurons that carry the signal out of the eye. For every output cell, there are therefore more than a hundred photoreceptors.
The consequence, as the review itself explicitly states, is that the retina does not send a point-by-point photograph to the brain. Ganglion cells work as parallel filters, each dedicated to an image attribute such as contrast, colour, movement, surface texture, or light level, and the authors count 18 types in the retina of primates and humans. Even before leaving the eye, the image has already been summarised.
The optic nerve carries most of these signals to the thalamus, at a relay station called the lateral geniculate nucleus, and from there to the primary visual cortex in the occipital lobe. This anatomical detail will come in handy when discussing sensors. The initial cortical processing of what we see takes place far from the eyes, at the back of the head.
The visual cortex breaks down the visual stimulus into lines
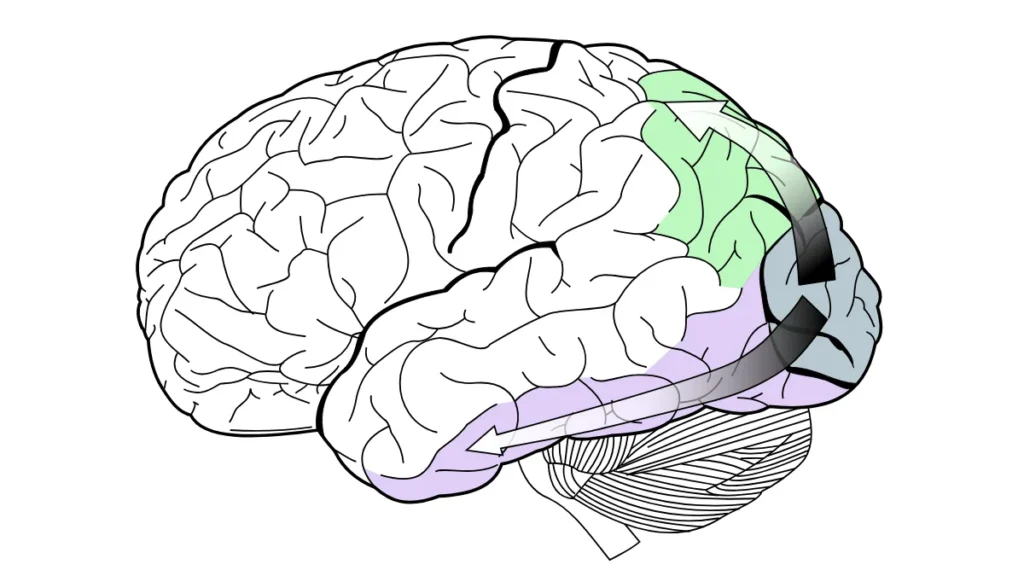
In the late 1950s, David Hubel and Torsten Wiesel began to record the activity of individual neurons in the cat’s primary visual cortex using fine tungsten electrodes. They found cells that responded little to a round spot of light and almost not at all to diffuse light, but reacted strongly to a thin strip of light or an edge between light and dark, provided they had a precise orientation. Each neuron had a preferred orientation, and cells with similar preferences were grouped into columns. For these discoveries on visual information processing, the two received the Nobel Prize in Physiology or Medicine in 1981, shared with Roger Sperry.
From that work came the idea of a visual system organised into stages, where the initial areas extract orientations, contrasts, and colours, and subsequent ones combine them into contours and objects. The distinction between two pathways originating from the primary cortex dates back to the early 1980s, when Mortimer Mishkin and Leslie Ungerleider described a ventral pathway, towards the inferotemporal cortex, dedicated to object recognition, and a dorsal pathway, towards the posterior parietal cortex, dedicated to their spatial location. In 1992, Melvyn Goodale and David Milner proposed a different interpretation of the dorsal pathway in Trends in Neurosciences, as a system that guides movements directed towards objects.
When a visitor recognises a brand on packaging, the ventral stream is primarily at work; when they reach out to pick it up, the dorsal stream comes into play.
One hundred and fifty milliseconds for a specific task
In the Toulouse results, the difference between the two conditions appeared as a negativity on the frontal electrodes, and for the authors, it was a sign that within a tenth and a half of a second, the outcome of the categorisation was already present in the signal. Subsequent studies, including one by the same Toulouse group, have observed that part of that early difference may depend on the physical characteristics of the images, and that task-related differences appear later.
In a subsequent paper, published in 2001 in the Journal of Cognitive Neuroscience, the same group discusses ultrarapid visual categorisation, because three weeks of training on a set of photographs did not account for that difference for familiar images compared to new ones. These timings apply to a specific task and do not extend to everything that happens when one looks at something. Judging whether an object is pleasing, connecting it to a memory, or deciding to approach it are subsequent steps, which are slower and more variable from person to person.
Visual Stimulus: To See Also Means Choosing What to Ignore
The speed of the initial analysis does not guarantee that everything entering the eye reaches conscious awareness. In 1999, Daniel Simons and Christopher Chabris published a now-famous experiment in Perception. Participants watched a video in which two teams passed a ball and were asked to count the passes made by one of them. At one point, a person dressed as a gorilla, or a woman with an umbrella, walked across the scene. Forty-six per cent of observers did not notice a thing.
Inattentional blindness, as the phenomenon is known, shows that attention works like a filter, and this filter leaves an electrical trace. The review by John Foxe and Adam Snyder published in Frontiers in Psychology in 2011 gathers evidence that the alpha rhythm, an oscillation between 8 and 14 cycles per second, increases in regions of the cortex that process irrelevant or distracting information, and performs a suppression function in the service of attention.
Some signals, however, still bypass the filter; indeed, in a study published in Psychological Science in 2003, Richard Abrams and Shawn Christ observed that what captures attention is the onset of movement. Elements that had just begun to move were processed preferentially even when the movement provided no useful information, whereas continuous movement did not receive the same advantage. In 2010, Abrams himself, with other colleagues, found the effect again even with stimuli lacking variations in brightness. Other researchers, however, have challenged this: in 2011, Meera Mary Sunny and Adrian von Mühlenen found that the effect only appeared when the movement on the screen proceeded in jerks, and disappeared with smooth movement.
When an image strikes us, the response moves forward

Recognizing an object and finding it beautiful are different operations, and the second is the subject of neuroaesthetics. In 2004, Hideaki Kawabata and Semir Zeki at University College London asked participants to classify a series of paintings in advance as beautiful, neutral or ugly, and then showed them the paintings inside a functional magnetic resonance imaging scanner. The study, published in the Journal of Neurophysiology, found that comparing beautiful and ugly paintings activated the medial orbitofrontal cortex, a frontal region involved in evaluating reward, regardless of the painting’s genre. Paintings judged ugly engaged the motor cortex more.
In 2012, Edward Vessel, Gabrielle Starr and Nava Rubin at New York University had sixteen observers look at 109 artworks from different styles and periods and asked them to rate, for each one, how strongly it moved them on a scale from 1 to 4. In the study, published in Frontiers in Human Neuroscience, activity in the occipito-temporal visual regions increased linearly with the rating. A network of frontal regions, which includes nodes of the so-called default mode network, was activated only by the works rated 4. This network is associated with self-directed thought and usually reduces its activity when attention is occupied by an external stimulus; in front of the most intense works, that reduction did not occur.
The two groups disagree on how to interpret the data. Vessel and colleagues challenge the idea, attributed to Kawabata and Zeki, of a linear relationship between perceived beauty and medial frontal activity, and attribute the difference to methodological choices such as the number of levels on the scale and the inclusion of ugly paintings. Both studies involve few participants and were conducted inside a scanner, a setting far removed from a gallery or an event.
A side finding of the American study is of direct interest to anyone who designs experiences. Agreement between observers was very low, with an average correlation of 0.13 between the ratings of any two people, and on average each artwork rated highly by one participant was rated low by another. The brain networks involved were largely the same for everyone, while the works capable of activating them changed from person to person.
What an electrode placed on the head records
Magnetic resonance imaging measures changes linked to blood flow and requires a scanner. Electroencephalography, or EEG, measures electrical activity directly and is much older. The German psychiatrist Hans Berger recorded the electrical activity of the human brain for the first time in Jena in 1924 and published his results from 1929 onward. He was the one who described the alpha rhythm, an oscillation between 8 and 14 cycles per second, and who noticed that its amplitude drops sharply when a person opens their eyes. The phenomenon still bears his name, the Berger effect, and it is the first documented example in humans of how the act of looking changes the trace. As early as the late nineteenth century, Richard Caton and Adolf Beck had observed in animals that light shone on the eye altered the brain’s electrical activity.
The signal picked up by an electrode on the skin arises from the synchronized activity of large populations of cortical neurons, attenuated as it passes through the skull and scalp. Its temporal resolution is on the order of milliseconds, fine enough to follow the 150 milliseconds of the Toulouse experiment. Its spatial resolution is poor, because each electrode sums the contribution of a wide area.
There is also an obstacle that concerns vision specifically. The eye behaves like a small electrical generator, with the cornea positively charged relative to the retina, and every movement of the eyeball or eyelid changes the field recorded by nearby electrodes. Technical documentation from TMSi, a company that manufactures EEG amplifiers, indicates that a blink artifact can reach 100–200 microvolts and is most visible on frontal electrodes, while background brain activity measures just a few microvolts or a few tens of microvolts. Anyone looking at something moves their eyes constantly, and the forehead is where this interference weighs most.
How the BrainArt sensor reads the response to a visual stimulus
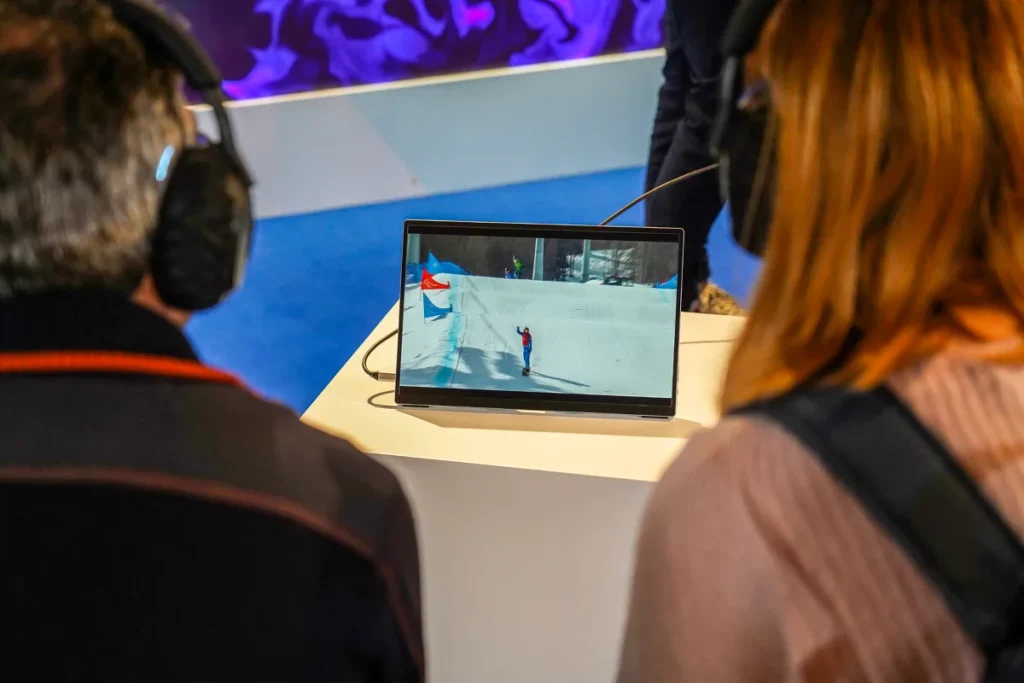
The sensor BrainArt uses at events is a dry-electrode EEG headband, the Muse 2 by InteraXon, which requires no gel and transmits the signal via Bluetooth. The device has two electrodes on the forehead, at positions AF7 and AF8 of the international 10-20 system, two behind the ears, at TP9 and TP10, and a reference in the middle of the forehead. Fitting it takes as little as one minute and requires no complex adjustments.
One consequence of this configuration needs to be stated clearly: none of the four electrodes sits over the occipital cortex, where visual information arrives first, so the sensor does not reconstruct the image the participant is looking at. It records the activity of frontal and temporal regions, which come into play at later stages of the response, such as the deployment of attention and orientation toward the stimulus, with the temporal precision typical of EEG.
What can be measured from the forehead and ears
That a response linked to a visual stimulus can be measured from those positions was verified by Olave Krigolson’s group at the University of Victoria, Canada. In the study published in 2017 in Frontiers in Neuroscience, 60 students wearing a first-generation Muse watched a sequence of green circles occasionally interrupted by blue circles, which they had to count. From the signals collected behind the ears, the researchers measured the N200 and P300 components, two brain responses to the rare stimulus, with waveforms different from those obtained in the lab but quantifiable on the group average, with higher reliability for the N200 than for the P300. The authors note that the P300 is usually maximal over the posterior midline, where the Muse has no electrodes.
The same article contains a comparison that clarifies what working in a lab means: with a 64-electrode system, two experienced assistants took an average of 35 minutes to fit the cap, apply the gel and bring impedances within acceptable values, and the entire session lasted an hour on average. With the Muse, setup and tasks were completed in under ten minutes.
Frontal asymmetry and the direction of the response
The two frontal electrodes, one on the left and one on the right, make it possible to compare the two hemispheres, and frontal asymmetry is based on this comparison. The review by Eddie Harmon-Jones and Philip Gable published in Psychophysiology in 2018 summarizes the evidence that greater relative left frontal activity is associated with the motivation to approach a stimulus, and greater relative right activity, with less evidence, with the tendency to withdraw from it. Activation is estimated from the power of the alpha rhythm, which varies inversely with the activity of the underlying cortex.
This literature describes a motivational direction, toward the stimulus or away from it. Anger, for example, is an unpleasant emotion that drives approach, and Harmon-Jones studied it precisely to separate the direction of motivation from pleasantness. A four-channel sensor cannot tell joy from surprise, and the picture should be read with this in mind.
Visual stimulus: from signal to artwork
The signal is processed by proprietary algorithms and turned into quantitative metrics, which in turn become visual parameters such as colors, shapes and motion dynamics. During the session, the participant sees a visualization on screen that changes in real time. At the end, the system generates the artwork (without the use of generative artificial intelligence), which is printed on site on photographic paper and handed over in a folder that can be customized with the host company’s brand.
Each artwork is explained to the participant by the on-site team of neuroscientists and psychologists. Color is linked to a more emotional or more analytical response, the complexity of the shapes to the level of arousal, and a base structure, that is, an individual signature, changes from person to person.
Designing the visual stimulus for your event
The path described so far, from the retina to the frontal response, can be designed. The stimuli BrainArt offers include videos, images and products to try, and the choice depends on what the event needs to achieve. A product launch, a trade fair and a corporate event each require something different.
Product launch: the product becomes the stimulus
With an audience of journalists and influencers, the goal is to tie the brand to memory through a specific moment of the experience. The visual stimulus then coincides with the product, whether it is an object to observe up close, a package or the launch video. The person looks at it while the sensor records their activity, and takes away an image created in that moment.
Trade fair: change is what catches the eye
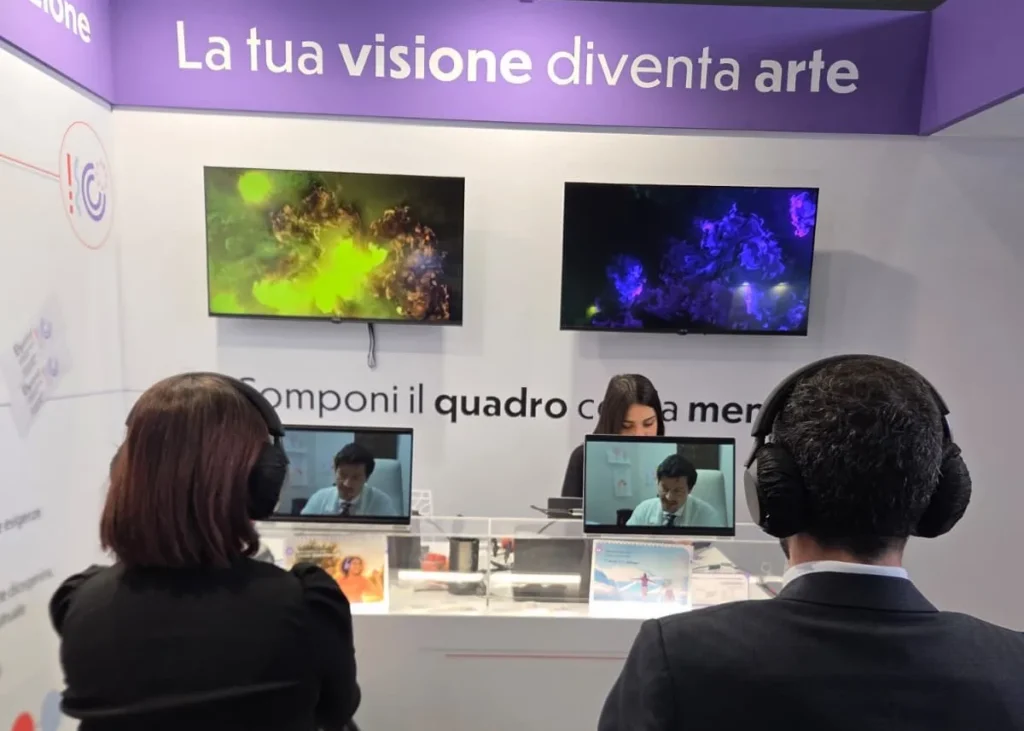
In an exhibition hall, the purpose is to bring traffic to the booth and collect contacts. A static graphic, however large, competes with hundreds of others and risks ending up in the part of the scene that the attentional filter discards, like Simons and Chabris’s gorilla. The BrainArt visualization changes in real time with the signal of whoever is wearing the sensor, and therefore continuously produces variations in shape and color on screen. Abrams and Christ’s data come from laboratory tasks, yet they point precisely to motion onsets as what captures attention.
The individual session also creates a natural moment for contact. The artwork is handed over in person in the folder, and the digital version reaches the guest via a personal QR code or by email, a step well suited to collecting contact details in compliance with privacy notices.
Corporate event: an image to take home
For a Christmas party, an anniversary or a kick-off, the purpose is memorability. The work of Timothy Brady, Talia Konkle, George Alvarez and Aude Oliva, published in PNAS in 2008, gives an idea of how large our memory for images is. Participants viewed 2,500 images of objects and then, presented with pairs of images, had to indicate which one they had already seen. They recognized the correct one 92 percent of the time when the alternative belonged to a different category, 88 percent when it was another exemplar of the same category, and 87 percent when it was the same object in a different state.
The study measures recognition of images seen in a lab and says nothing, on its own, about an artwork taken home. It does, however, help in thinking about the comparison with the photobooth found at every corporate party. The souvenir photo captures a person’s appearance at an arbitrary moment of the evening, is not tied to any particular stimulus and resembles many other photos of the same kind. The BrainArt artwork comes from the person’s response to a stimulus chosen by the organizer, looks different from those of colleagues who used the same station, and comes with an explanation received on the spot. The difference lies in designing for memory, that is, building the experience around content you want people to remember.
Perception data collected in real-world conditions
A fourth function can be added to these. When the engagement involves experiential neuromarketing, the signals recorded while participants watch an ad, a package or a product become perception data delivered to the brand; the system collects over 80 metrics that feed into a report. In this case the way of working changes, because there is a study behind it. Device calibration, handling of the ocular artifacts described above and standardization of the stimulus must hold up to analysis.
A comparison with the lab is in order: a session with dozens of electrodes, gel and eye tracking produces far more data than a four-channel headband that does not cover the visual cortex and cannot tell where the gaze lands. In the lab, however, the person knows they are being observed, remains still and wired up, and performs a task built specifically for the purpose. At the event, the same person looks at the product while seated at the booth, within an experience they have chosen BrainArt collects less data, but in conditions much closer to those in which the product will actually be seen.
Video as a visual stimulus in four BrainArt events
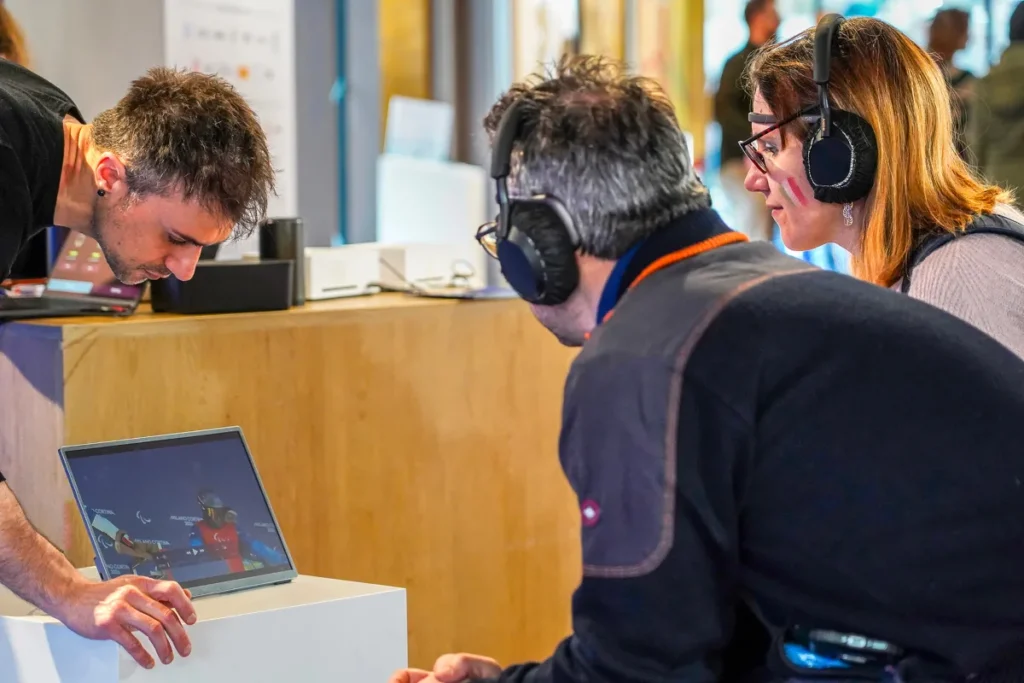
Video is a visual stimulus that unfolds over time. As it plays, shots, colors and pace change, and the sensor records the response throughout the viewing, with the temporal resolution that makes EEG suited to following a moving stimulus. For a company there is also a practical advantage, because the content often already exists. Four events produced by BrainArt show how the same format adapts to different goals.
For Big Graniti, the stimulus was a corporate video. It is the simplest and most replicable case, because almost every company has an institutional film, which at events often ends up looping on a screen in front of passers-by. Within the BrainArt experience, the same film is watched from beginning to end by a person seated in front of the screen, and the resulting artwork comes from that viewing.
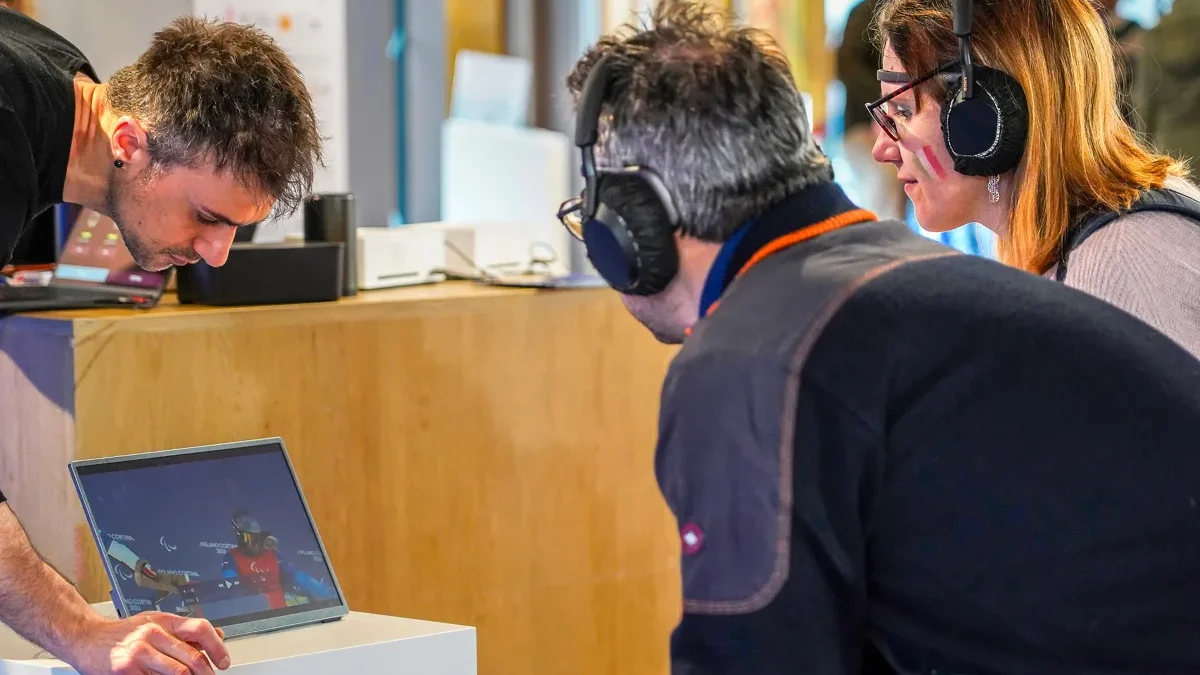
With Ottobock, the video was dedicated to the Paralympics, and therefore to a story rather than a product. The participant follows a narrative, and the artwork they take away remains tied to the theme the brand chose for that event.
For CopiaIncolla, the video retraced the agency’s achievements and the most significant moments of its 2024. It is the stimulus that comes closest to the personal relevance discussed by Vessel and colleagues, because for those who lived those moments, the content is also about their own story. On this occasion, the artwork therefore recorded a person’s response to a year of work they had been part of.
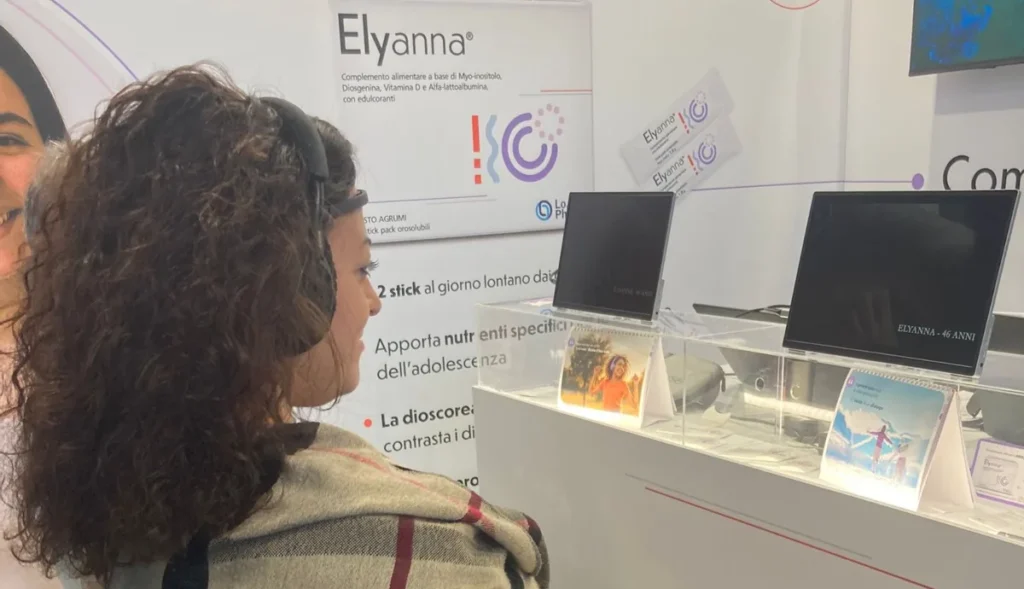
Lo.Li. Pharma brought BrainArt to a trade fair with a video dedicated to Elyanna, the new food supplement presented on that occasion. The case brings together both needs of a booth launching a product. The real-time visualization works on drawing in visitors, and those who sit down watch the video of the newly presented product for the entire duration of the experience, which thus becomes the origin of their artwork.
A century after Berger
There is an irony in the history of this technique. According to the account by the Max Planck Institute for Biological Cybernetics in Tübingen, the young Berger, during his military service, fell from his horse and was nearly run over by an artillery wagon. That same day his sister, many kilometers away, had the feeling that something serious had happened to him and insisted on sending him a telegram. Berger became convinced it was telepathy and built his instrument to look for a physical trace of it in the brain. He found the alpha rhythm and its sensitivity to the opening of the eyes. The technique born from that research records with great precision when the brain responds to what it sees, and still says nothing about what the person is thinking.

Domande frequenti
The retina converts light into electrical impulses and compresses them into about 1.2 million fibers of the optic nerve. The signal passes from the thalamus to the primary visual cortex, in the occipital lobe, which breaks it down into lines and contrasts. Later areas recognize objects, while frontal regions assess their interest and pleasantness.
In an experiment published in Nature in 1996, participants had to say whether a photo shown for 20 milliseconds contained an animal. Brain activity distinguished the two conditions about 150 milliseconds after the image appeared, while the manual response came later, because the time needed for movement is added to the time needed for vision. These timings apply to a simple, specific task. Recognizing more specific categories takes longer, and judging whether an object is pleasing is a later step.
Neuroaesthetics studies how the brain responds to beauty and to works of art. Magnetic resonance imaging studies associate judgments of beauty with medial frontal regions, and the works that strike us most activate nodes of the default mode network. One of these studies, conducted at New York University, also showed that the works capable of striking us vary greatly from person to person.
No. An EEG sensor records how the cortex’s electrical activity changes over time, with millisecond precision, and does not reconstruct the content of an image. A headband with electrodes on the forehead and behind the ears does not cover the occipital cortex and captures later stages of the response, such as attention and orientation toward the stimulus.
The visual stimulus is what the participant looks at while wearing the sensor, and it is chosen according to the purpose of the event. At a launch it can be the product itself or the launch video; at a trade fair, content linked to the exhibitor’s brand. The real-time visualization and the printed artwork are what the experience gives back. The former draws people to the booth, the latter remains as a memento of the event.
In the lab, dozens of electrodes, gel and eye tracking are used, and the person knows they are being observed while performing an artificial task. BrainArt uses a four-channel sensor that collects less data, but records it while the participant is living an experience at a real event, close to the conditions in which the product will be seen.


Rendi unico il tuo evento con BrainArt®!